Custom Congressional Data Sheets & Maps
We are very pleased to offer new, custom services to help CDFIs and CDFI investors, CDFI Coalitions, and industry advocates present more detailed views of their impact. You decide the places and type of advocacy tools your organization wants.
Submit the form below to receive a quote for the service you choose.
Custom Data Sheets
Starting at $200*
You choose the congressional districts and/or states, and we will produce a concise data sheet spotlighting:
Total CDFI lending (2005-2022)
Average CDFI lending per person
Average CDFI lending vs. the national average
Percentage of Qualified Investment Area tracts
Percentage of “CDFI Opportunity Market” tracts
and more.
You can use these data in your advocacy work to show the impact of, and opportunity for more, CDFI lending.
*Your order price is determined by the number of geographies (congressional districts & states) you request.
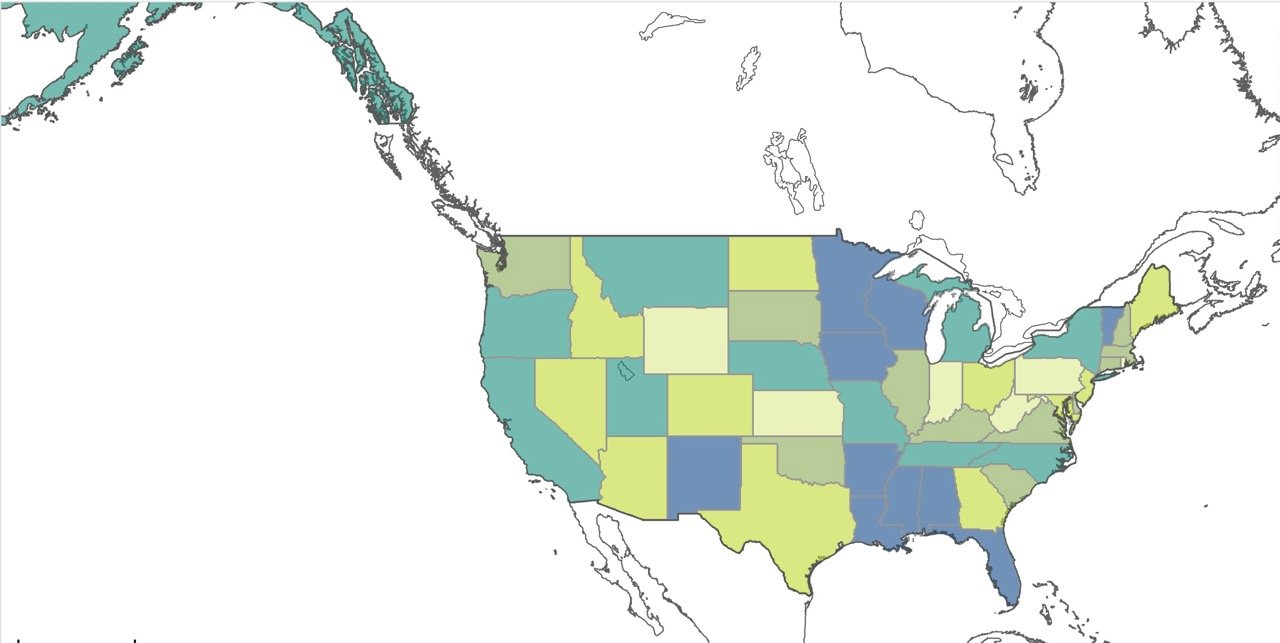
Custom Maps
Starting at $2,500*
Using TLR (transaction-level reporting) data from your CDFI, we will create a custom mapping tool that displays your lending at either the address- or census tract-level. It will overlay the total CDFI lending in your market and include all congressional and state layers from our CDFI Advocacy Map. You can use your custom map internally or it can be embedded in your website.
*Price may increase depending on the data you provide and/or the way you want it displayed.
Submit a Custom CDFI Lending Map or Data Sheet Request
Please complete the form below to submit your request.
For your custom data sheet, we need to know the congressional districts and/or states you want to profile. Pricing is based on the number of places you choose.
For custom CDFI Lending Maps, you will need to provide TLR data for the CDFI(s) you want to include. We will finalize the price and confirm it with you before we produce your map.