Introducing the CDFI Market Map
An announcement from CDFI Friendly America’s President, Mark Pinsky
CDFI Friendly America’s New, Free Online Tool Spotlights CDFI Growth Opportunities & Identifies ‘CDFI Deserts’
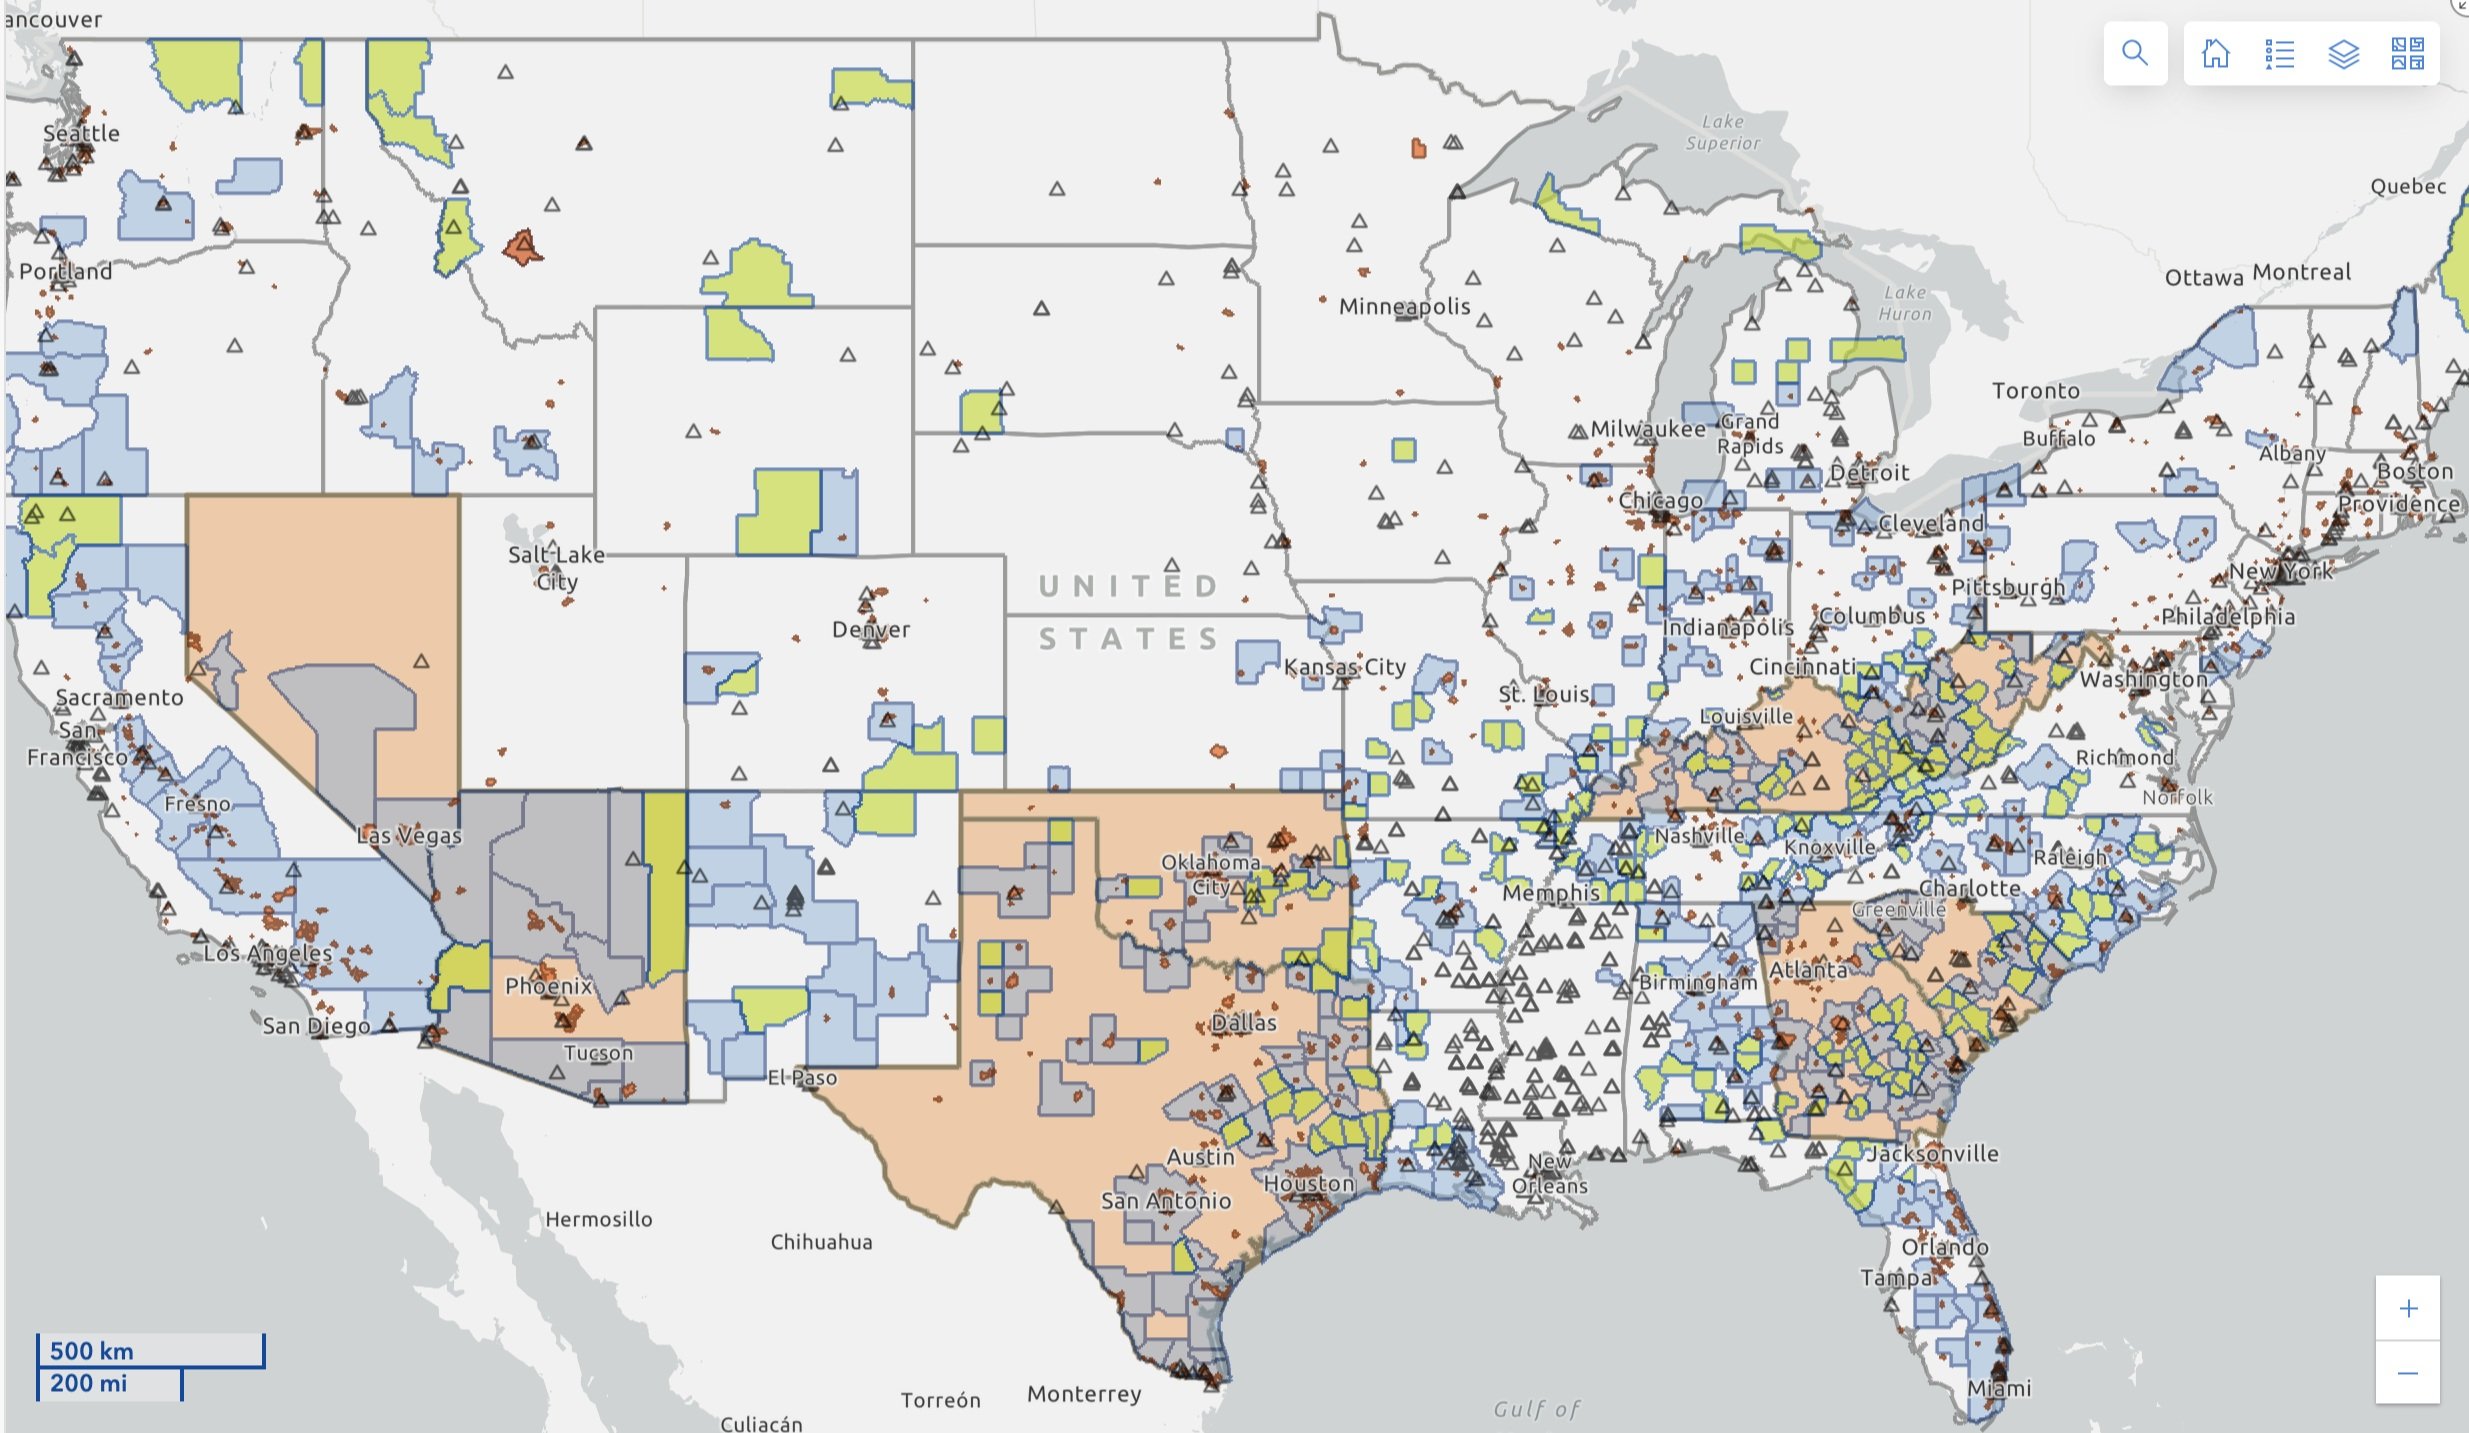
We are very excited to introduce the CDFI Market Map, a new, free tool that makes it easy to see the market potential for CDFIs any place in the U.S. It is a tool for CDFIs, Mayors and local officials, bankers, bank regulators, philanthropists, and impact investors.
With the CDFI Market Map, we are providing the first quantitative analysis of where CDFIs are and are not lending nationwide. There are 1,292 CDFI “Deserts” in the U.S.—places with populations of 10,000 or more where the need for CDFI financing is high but historical CDFI financing is low. The number of CDFI Deserts reinforces the fact that the need for CDFI products and services will continue to grow rapidly for decades to come.
Click here to see the list of all 1,292 places.
The CDFI industry and its allies have long known that CDFIs do not “cover” all of the nation. This is the first time, however, that anyone has sized the coverage gaps–or CDFI Deserts.
CDFIs are “financial first responders” offering customized loans for small businesses, consumers, homeowners, housing developers, commercial real estate developers, nonprofits, and others. Almost 1,500 CDFIs are working today in all 50 states in urban, rural, and Native communities (the CDFI Market Map includes the primary office locations of these CDFIs.)
The CDFI industry has effectively pursued national scale for more than 30 years growing to total assets of $450 billion, according to the Federal Reserve Bank of New York. And its value has increased through its partnerships with banks, impact investors, corporate investors, policymakers, local and state officials, and others.
Now, we believe, the industry must also focus on “scope”—meeting CDFI demand in CDFI Deserts.
CDFI Friendly America’s goal is to eliminate CDFI Deserts by 2040. To that end, it is expanding its services to help communities, towns, and cities become CDFI Friendly communities. It works with local residents, community leaders, public officials, bankers, business leaders, and philanthropy to organize local CDFI markets around CDFI “hubs” that match local demand to CDFIs across the nation.
CDFI Deserts are places where:
CDFI lending from 2005-2022 totals less than 80% of the national average of $714 per person (80% = $571 per person), and
A majority of the census tracts are economically distressed based on data from the U.S. Department of the Treasury CDFI Fund’s Qualified Investment Area data set.
For the CDFI Industry, the CDFI Market Map shows where opportunities are for expansion and growth. I am confident that the CDFI industry and its allies will step up when they see the opportunities that CDFI Deserts present. In the five (5) CDFI Friendly places that are up and running, dozens of CDFIs have shown up to lend.
For local community leaders, it can be the first step in identifying the financing gaps in your communities. We want to help you meet your local demand for CDFI resources.
To find out how CDFI Friendly America can help in your community, schedule a 30-minute information call with me, about our CDFI Friendly work.
The Map will also help CDFIs and communities seeking to participate in the once-in-a-generation Greenhouse Gas Reduction Fund (GGRF) program. It identifies “Justice40” areas, which are key to the GGRF.
Because CDFIs tend to lend where they are already working, many CDFI Deserts will miss out unnecessarily on the GGRF, which is expected to generate more than $100 billion in new, green financing in historically underfinanced places by 2030. We are determined to find and flag green financing opportunities for CDFIs in places where they are not yet working. We want to connect CDFIs to as many CDFI Deserts as we can, as soon as we can.
The CDFI Market Map offers national, state, metro area, county, city, place, and census tract level views, giving users flexibility in how they approach markets.
At the County level, there are 853 CDFI Desert Counties, 34% of all counties.
At the Metro Area level, there are 310 CDFI Desert Metro Areas, 33% of all Metro Areas, and
At the States and Territories level, there are 9 CDFI Desert States/Territories, 17% of all States & Territories.
There is demand for CDFI financing in even more places than we identify as Deserts. Some larger areas that are not classified as CDFI Deserts contain pockets of high need at the census tract level, which is why we use census tract-level analyses in our data assessments and mapping tools. In addition, many communities with high CDFI financing levels historically do not have CDFIs offering the full spectrum of CDFI financing types. For example, they may have adequate CDFI financing for multifamily affordable housing but not for single-family mortgages or small businesses.
In the coming weeks and months, CDFI Friendly America will add data layers to enhance the value of the CDFI Market Map.
The CDFI Market Map and a CDFI Market Map User Guide page are available now. An advanced, more comprehensive version of the tool, that contains added metrics and data, will be available as a customized service for a fee. Please email us at info@cdfifriendlyamerica.com if you are interested in an advanced or customized version of the map.
Mark Pinsky
President, CDFI Friendly America