New Analysis of CDFI Lending Shows Investments in 100% of Congressional Districts and States
Data presented in a new mapping tool for CDFIs gives the most complete look yet at how congressional appropriations reach communities nationwide through CDFIs.
In a revealing new analysis, CDFI Friendly America (CFA) has documented the impressive breadth and depth of lending by community development financial institutions (CDFIs) funded by the CDFI Fund in the U.S. Department of the Treasury. The data are presented in the new CDFI Advocacy Map.
The CDFI Advocacy Map is a new tool developed by CFA for Congress and for CDFI leaders and investors as the industry steps up its work to advance the CDFI Fund and other CDFI-centered strategies. Advocates will use it to provide real-time information to policymakers and the media about local, state, and national CDFI financing.
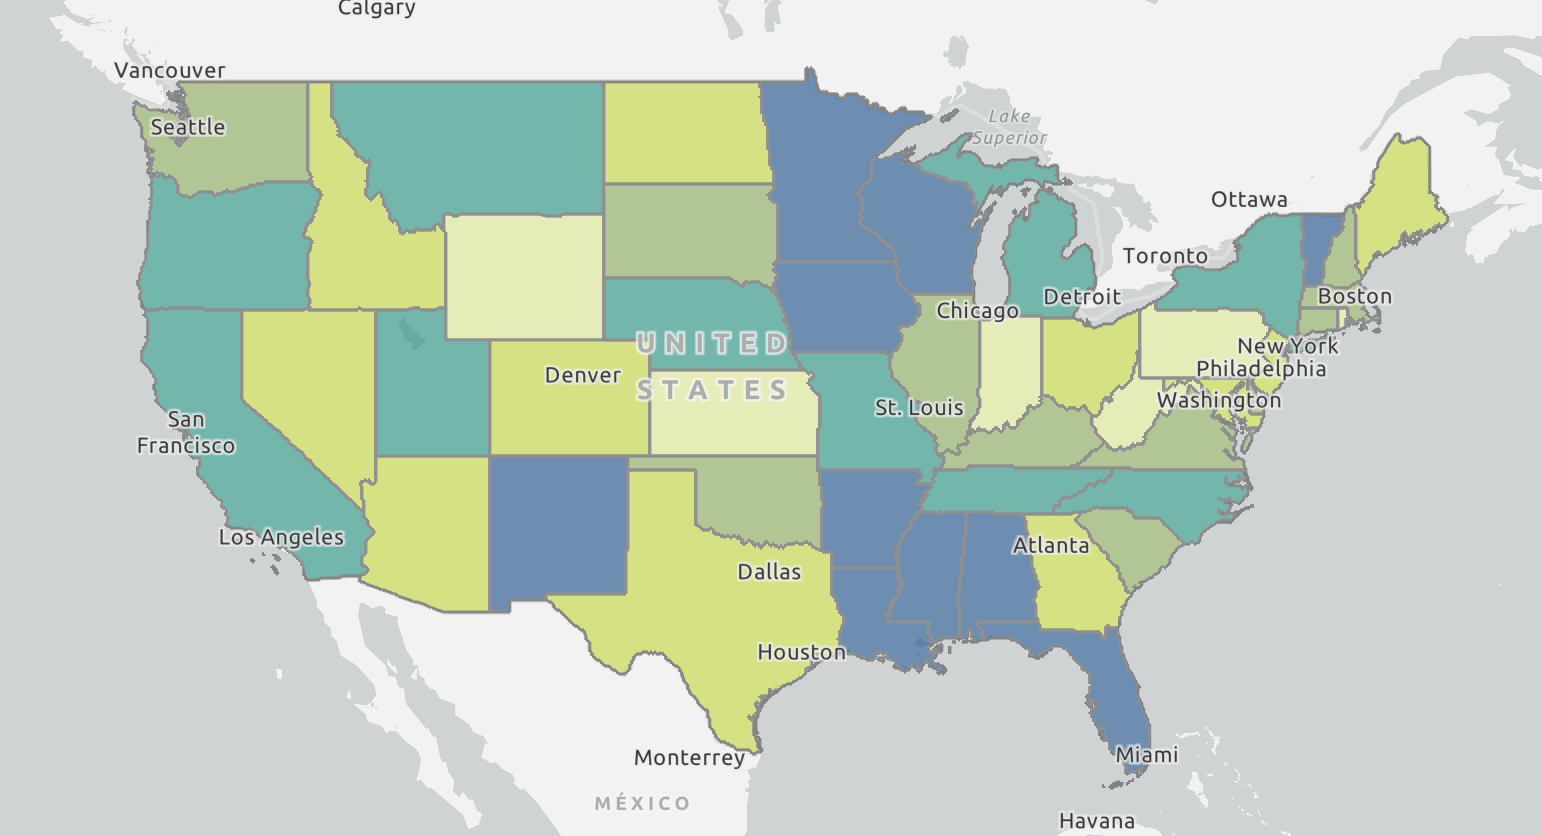
Try the map today to see CDFI lending across the U.S. organized by Congressional Districts and States to focus legislators on the places they care about most.
According to the Map, 100% of Congressional Districts—and, so, 100% of U.S. states and the District of Columbia—have received CDFI financing between 2005 and 2022, the most recent year for which data are available.
“There is much more work for CDFIs to do in all the places where they work,” according to Mark Pinsky, CFA’s President. “CFA’s data also identify 1,292 priority CDFI ‘opportunity markets,’ communities where the need is high for more CDFI lending.” Like many other federal programs, he added, CDFIs are facing unprecedented headwinds at a time when they are more important than ever.
In total, CDFIs loaned more than $245 billion—or $714 per person—in rural, urban, and Native communities over the 18-year period 2005-2022.